Push & Pull: Reducing DynamoDB spend with CDC & Kinesis
This blog post originally appeared on Propel's blog. You can also view it there.
Propel allows you to expose data sources like Snowflake, Amazon S3, and Kafka, safely and securely through our blazing-fast GraphQL and SQL APIs. We do this by continuously replicating or “syncing” these data sources into optimized tables in ClickHouse, from where we serve queries. We support syncing on a configurable schedule (the “sync interval”), pausing and resuming syncs, as well as manually triggered syncs.
We call the system powering this functionality our “sync scheduler”, and, at its most basic, it’s responsible for monitoring changes to configured sync intervals and scheduling syncs accordingly. To do this, the sync scheduler needs to maintain an up-to-date view of the currently configured sync schedules. Given that we store all of the sync intervals in our application database, how did we implement this?
First approach: pull-based
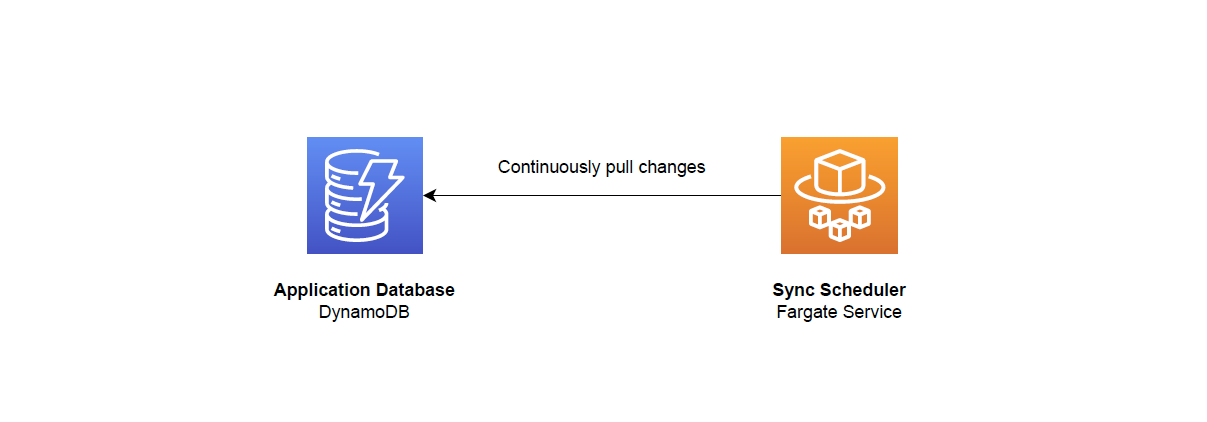
Our first implementation of the sync scheduler was simple: the up-to-date sync intervals exist in our application database, so just continuously poll the application database for changes.

This approach was quick to implement, easy to read and reason about, and it worked! In pseudo-code, it looked something like this:
// Continuously poll DynamoDB
while (!signal.aborted) {
  for async (const syncIntervals of pageThroughSyncIntervalsInDynamoDB(shardId)) {
    updateSyncIntervalsInMemory(syncIntervals)
  }
}
There was just one creeping problem: our application database is DynamoDB, and with DynamoDB you pay per read request. So, as we grew, this approach became more and more expensive. This might not be a problem with a self-hosted PostgreSQL cluster, where you don’t pay per read request, but not so with DynamoDB. It was time to optimize…
New approach: push-based
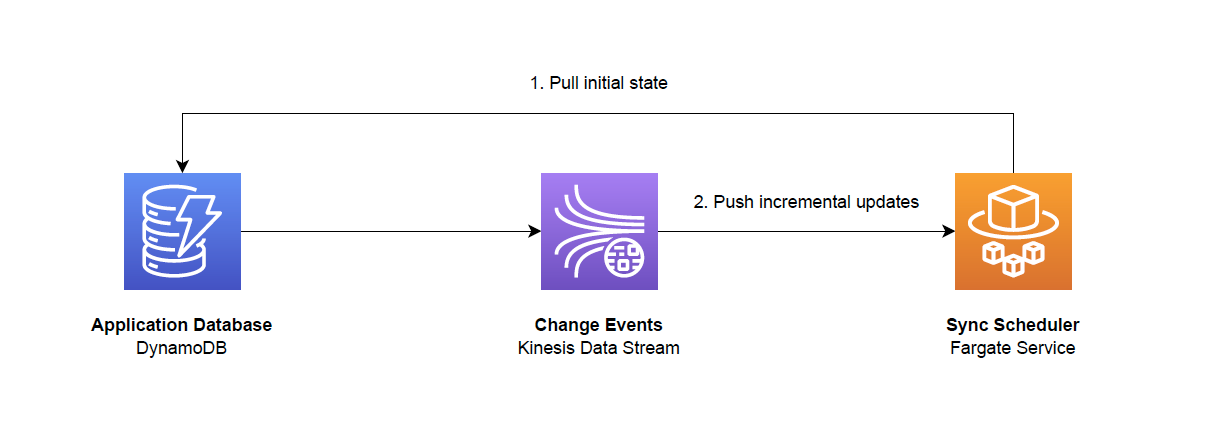
Instead of having the sync scheduler “pull” changes from the application database, what if we instead had the application database “push” changes to the sync scheduler? Considering that sync intervals change infrequently, this would be a big optimization! But how can we do it?
It turns out DynamoDB can publish change data capture (CDC) information to Kinesis Data Streams. This means that every time a sync interval is configured, a CDC event is published to a Kinesis Data Stream, and our sync scheduler can react to it.
Now, instead of continuously polling DynamoDB, our sync scheduler
- polls DynamoDB once at launch time to gather the initial set of sync intervals and then
- switches over to the Kinesis Data Stream for incremental updates.

In pseudo-code, it looks something like this:
// Poll DynamoDB once for initial state
for async (const syncIntervals of pageThroughSyncIntervalsInDynamoDB(shardId)) {
  updateSyncIntervalsInMemory(syncIntervals)
}

// Subscribe to Kinesis Data Stream for incremental updates
kinesisDataStreamObservable.subscribe({
  next (syncInterval) {
    updateSyncIntervalsInMemory([syncInterval])
  }
})
Of course, there are many details omitted here, including how to handle out-of-order events, failure and recovery, etc. Despite that, we managed to package up these changes behind an interface and introduce it to our sync scheduler behind a flag. This would enable us to roll it out safely…
Rollout
Successfully rolling out any change requires good observability, and that was true for this change as well. In the case of our sync scheduler, we have a service-level indicator (SLI) in Honeycomb that measures whether a sync was scheduled and executed “on time”, modulo some grace period. We then have a service-level object (SLO), ensuring the SLI passes 99.99% of the time within our SLO window. By monitoring the SLO for failure during the sync scheduler’s roll out, we could ensure the change was successful.

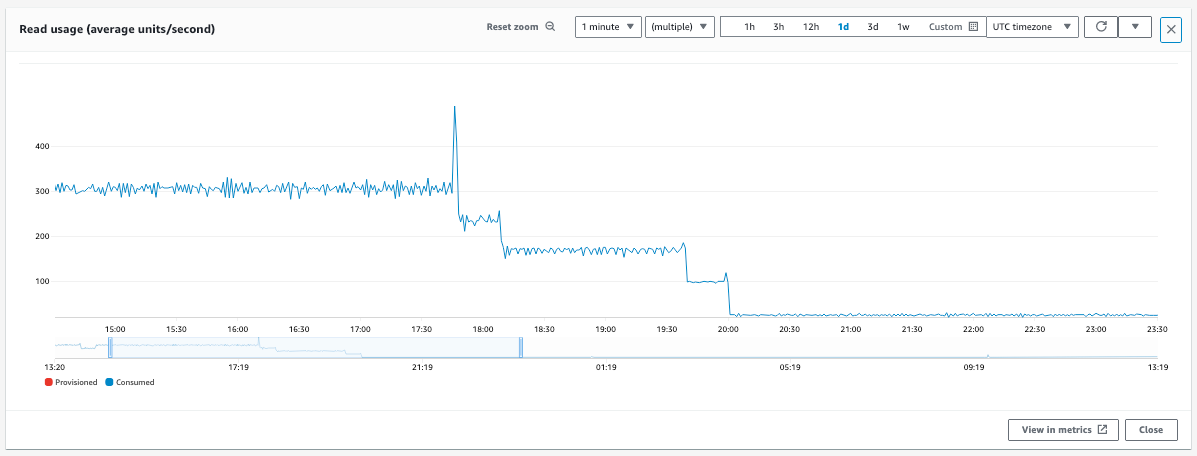
In order to de-risk the deployment, we avoided rolling out the change to all of our sync scheduler shards at once. Instead, we rolled out the change gradually, shard-by-shard, monitoring as we deployed.
In the screenshot below, you can see the deployment effects on our global secondary index (GSI) read usage in DynamoDB: as we slowly updated each shard, read usage stepped down significantly. Overall, we saw a 90% reduction in read usage for our GSI.

Conclusion
Our first implementation was inefficient, grew to be expensive, and ultimately needed to be replaced. Does that mean it was a mistake? No, I don’t think so. Our first implementation embodied the KISS principle (”Keep it simple, stupid!”) and allowed us to iterate quickly and move on to other things. We only came back to optimize when we needed to.
Additionally, setting up DynamoDB CDC over Kinesis Data Streams was an interesting adventure in itself. Getting DynamoDB CDC into Kinesis Data Streams is straightforward; however, we needed to consume the change information from TypeScript, which is what our sync scheduler is implemented in. Although there is a Kinesis Client Library (KCL) for TypeScript, it calls out to Java, and we preferred not to complicate the sync scheduler with it. Instead, we expose the Kinesis Data Stream to TypeScript (and any other client) using server-sent events (SSE), something I’m keen to write about in the future.